Picture the following scenario:
You are new to dbt. After a week and a half of late nights with you and your keyboard, you submit your first written workflow for code review on a Friday morning and breath a deep sigh of relief after a job well done. You then decide, since you are now consider yourself a dbt master, to review a peer’s code while you wait. Assigning your name to a workflow you assume will be easy to review and allow you to coast into your weekend, you then open up the most complicated set of code ever developed containing 8 different models that each reference each other in what could be true code-ception. THE HORROR. You can’t easily understand the relationships between the models your teammate has devised since one files holds over 400 lines of join logic, but another model is only used to convert the datatype of one singular column.
You start asking yourself questions. Where does this source come from? How did the table get referenced in this model? Why are we converting another datatype after leaving the staging table? Did said teammate even test this logic?!
Are anyone else’s palms starting to sweat???
Releases to the Rescue!
Never fear, because starting in dbt Cloud v1.1.33 (August 18, 2021), a Directed Acyclic Graph (DAG) has been added to the Integrated Development Environment (IDE) to help developers visualize the relationships between all models in their projects. After some deep breaths, let’s dive into what a DAG is, why it is helpful in dbt Cloud, and how we can best utilize this amazing resource during development.
WHAT IS A DAG?
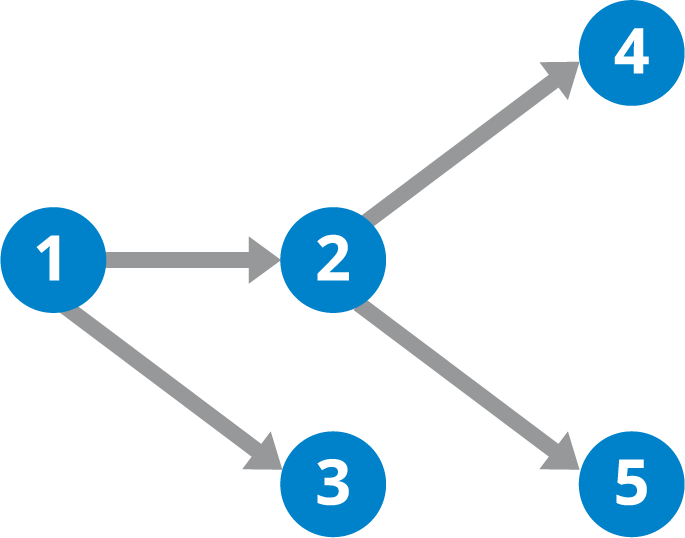
A DAG is a tool used to visually display directional relationships between a series of jobs or models. The Directed and Acyclic parts of the acronym establish a directional linearity that does not repeat without repeating the entire flow from the start. Graph adds the visual component that the shows declared relationships between models. Using the image below, we could imagine node 1 as our source, and nodes 3,4,5 are targets.
WHY IS IT BENEFICIAL?
A DAG can be used to demonstrate the data lineage from source to target and the parent-child relationships between the models. By having a graphical tool, these complicated workflows can be deconstructed into smaller subsections specific to a source, a staging model, or a target. Since so much of dbt code is reliant on building models upon previously constructed models, all downstream code has an upstream reference written within the code. This type of referencing is manageable without any help when the workflow is small, but as the number of models increases, so does the complexity of understanding the nuanced parent-child relationships.
Let’s say we are trying to read a teammate’s code, and we aren’t really sure how the models developed relate between each other. This would be the perfect use case for a DAG!
DAG & DBT INTEGRATION!
By adding this resource to the dbt Cloud IDE, developers get to see the live inter-model relationships as they write the code. In the specific use case of dbt, the DAG functionality is critical since our workflows are built upon models referencing one another.
DAG Colors
- Green: Sources
- Blue: Models
- Purple: Selected Model
And better yet, the DAG is interactive! Double clicking on any of the models within the DAG will open the code as a newest tab in the IDE. If you want to do some more investigation within your entire project, open the []Expand button under the Lineage tab and type into the search box what you are looking for. This functionality can be used to show all models downstream from a source, the entire view to create a target, or the upstream and downstream lineage of a particular model. Any of these models can be clicked on and will open within the IDE as well. The interactivity of the DAG lets you navigate your code visually by clicking the models of interest, instead of strictly relying on brainpower or guesswork to select the next model in the workflow.
Release Note Specifics and Resources
It’s easy to brag about a feature that you personally utilize every day when discussing release notes. Hence, this is the reason I highlighted the DAG in the IDE. While the original DAG functionality was added in dbt Cloud v1.1.33 (August 18, 2021), here are the cliff notes of some additional changes that add to it’s extraordinary power.
Interesting Changelog Tidbits
- dbt Cloud v1.1.33 (August 18, 2021) - This release brings the developed DAG to the dbt Cloud IDE.
- dbt Cloud v1.1.37 (October 13, 2021) - The command,
dbt build, runs your complete workflow in DAG order. Basically, the DAG gives the relational visualization for everything in your kingdom that will execute while runningdbt build. - dbt Cloud v1.1.44 (February 2nd, 2022) - Add the double click enhancement to the DAG so that the model selected will automatically open in the IDE for your code viewing pleasure and quick navigation.
DAG Resources
If you are looking for more information about the dbt DAG, this is a good place to start.
- Demo on the dbt Cloud v1.1.33 DAG release
- Introductory DAG article with some more good information by Claire Carroll
- Information on checking and upgrading your dbt version
Spotlight of the Week!
As we know, Empowered Women Empower Women. I plan to live out this mantra by amplifying one of my favorite things: women making their mark in tech. My goal each week is to highlight women I look up to, organizations I support, and general knowledge that I find interesting that pertains to this topic. This week, check out my blog post about Elpha.
Thanks for reading! Please shoot me an email with questions, comments, or information I didn’t know about yet!


